Content
Published:
This is an archived release.
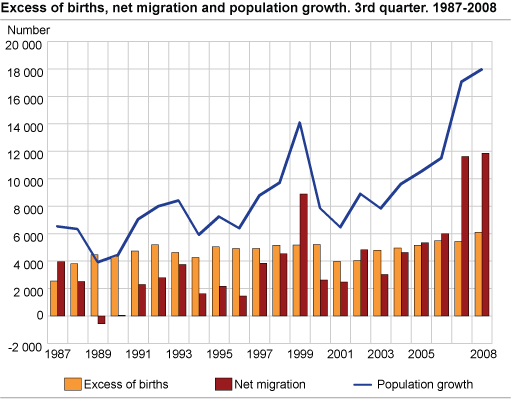
Continued high population increase
In the third quarter of 2008, Norway’s population increased by 17 900. Two thirds of the growth resulted from inward migration, but the birth surplus grew more than the net inward migration when compared to the third quarter 2007.
The population reached 4 787 000 on 1 October. The population increase of 17 900 is the highest ever registered in a single quarter, and was 900 higher than in 2007.
A total of 19 150 1 persons migrated to Norway and 7 300 left during this period, resulting in a net inward migration of 11 850 1 . In the third quarter last year, the net inward migration was 11 600, while in previous years it was almost 6 000 at its peak.
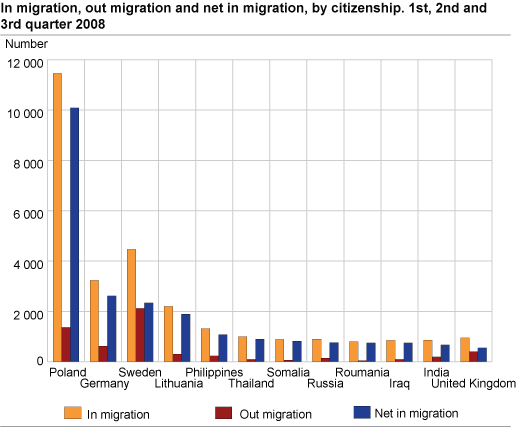
Polish citizens continue migrating to Norway
Of the 16 300 immigrants without Norwegian citizenship arriving in the third quarter, 67 per cent were Europeans. Polish citizens dominated, with 3 450 migrating to Norway, compared to 3 850 during the same quarter in 2007. While slightly fewer Polish citizens migrated to Norway during the third quarter than on average for the first two quarters this year, more Swedish and German citizens migrated to Norway than on average for the first two quarters.
Many children born
A total of 15 900 children were born in the third quarter; 600 more than last year. A total of 9 800 persons died; 100 fewer than in the corresponding period last year. The birth surplus thus reached 6 100; 12 per cent higher than in the same quarter in 2007. Oslo had the highest birth surplus (1 500), and only two counties saw a birth deficit, Hedmark (60) and Oppland (30).
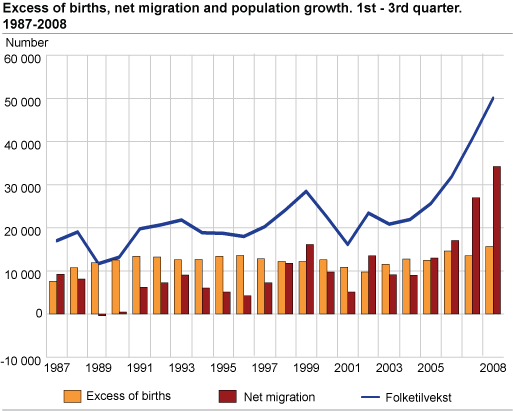
In the first three quarters of 2008, 46 550 children were born, whereas the number of deaths was 30 900. This resulted in a birth surplus of 15 650; 16 per cent higher than the corresponding period of 2007.
Largest population growth in central areas
Forty per cent of the population growth took place in Akershus and Oslo, and 23 per cent in Rogaland and Hordaland. Sogn og Fjordane, Nordland and Finnmark experienced a population deficit due to domestic migration loss.
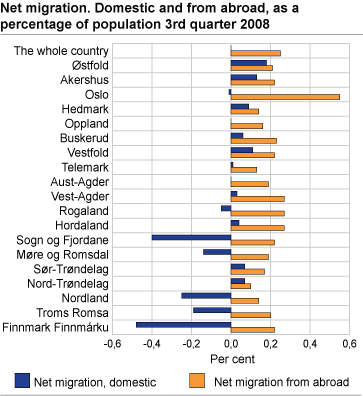
Nine counties experienced domestic migration loss in the third quarter
All counties had an inward migration surplus from abroad, with Oslo having the highest figure
(3 100). Ten counties had a domestic migration surplus, with Akershus having the highest figure (650). Nine counties had a domestic migration deficit, with Nordland having the highest (600).
In the first three quarters of 2008, Oslo had the highest inward migration surplus from abroad (8 600). Ten counties had a domestic migration surplus, with Akershus having the highest figure (1 800). Nine counties had a domestic migration deficit, with Nordland having the highest (1 150).
Population growth in 263 municipalities in the first three quarters of 2008
The population increased in 263 municipalities in the first three quarters of 2008, and decreased in 163 municipalities. Apart from the four largest cities, Bærum had the biggest population growth (1 300). As has been the case in recent years, centralised municipalities experienced a population increase, while less centralised areas were more likely to see a migration loss as well as a birth deficit.
Birth deficit in many inland municipalities
A total of 226 municipalities saw a birth surplus, whereas 190 experienced a birth deficit. Of the 10 municipalities with the largest birth deficit, nine were situated in the inland counties Hedmark and Oppland.
| Total migration gain (270 in total) | Domestic migration gain (147 in total) | Migration gain from abroad (414 in total) | |||||||||||||||||||||||||||||||||||||
|---|---|---|---|---|---|---|---|---|---|---|---|---|---|---|---|---|---|---|---|---|---|---|---|---|---|---|---|---|---|---|---|---|---|---|---|---|---|---|---|
| 1 | 0301 Oslo | 8 650 | 1601 Trondheim | 616 | 0301 Oslo | 8 632 | |||||||||||||||||||||||||||||||||
| 2 | 1201 Bergen | 2 140 | 0235 Ullensaker | 614 | 1201 Bergen | 1 863 | |||||||||||||||||||||||||||||||||
| 3 | 1601 Trondheim | 1 510 | 0602 Drammen | 464 | 1103 Stavanger | 1 393 | |||||||||||||||||||||||||||||||||
| 4 | 1103 Stavanger | 979 | 0106 Fredrikstad | 321 | 1601 Trondheim | 894 | |||||||||||||||||||||||||||||||||
| 5 | 0219 Bærum | 883 | 0226 Sørum | 278 | 0219 Bærum | 820 | |||||||||||||||||||||||||||||||||
| 6 | 0602 Drammen | 816 | 1201 Bergen | 277 | 1102 Sandnes | 608 | |||||||||||||||||||||||||||||||||
| 7 | 0235 Ullensaker | 773 | 1247 Askøy | 226 | 1001 Kristiansand | 563 | |||||||||||||||||||||||||||||||||
| 8 | 0106 Fredrikstad | 671 | 0627 Røyken | 223 | 0220 Asker | 478 | |||||||||||||||||||||||||||||||||
| 9 | 1001 Kristiansand | 615 | 0806 Skien | 213 | 1902 Tromsø | 470 | |||||||||||||||||||||||||||||||||
| 10 | 0220 Asker | 595 | 0104 Moss | 195 | 1106 Haugesund | 369 | |||||||||||||||||||||||||||||||||
| Total migration loss (154 in total) | Domestic migration loss (280 in total) | Migration loss to abroad (10 in total) | |||||||||||||||||||||||||||||||||||||
| 1 | 1924 Målselv | -135 | 1103 Stavanger | -414 | 1824 Vefsn | -37 | |||||||||||||||||||||||||||||||||
| 2 | 1824 Vefsn | -98 | 1805 Narvik | -188 | 0827 Hjartdal | -5 | |||||||||||||||||||||||||||||||||
| 3 | 1805 Narvik | -94 | 1924 Målselv | -146 | 1657 Skaun | -3 | |||||||||||||||||||||||||||||||||
| 4 | 0533 Lunner | -76 | 1401 Flora | -130 | 1835 Træna | -2 | |||||||||||||||||||||||||||||||||
| 5 | 2021 Kárájohka Karasjok | -76 | 1804 Bodø | -127 | 1740 Namsskogan | -2 | |||||||||||||||||||||||||||||||||
| 6 | 1231 Ullensvang | -60 | 1102 Sandnes | -117 | 1825 Grane | -2 | |||||||||||||||||||||||||||||||||
| 7 | 1411 Gulen | -53 | 2003 Vadsø | -116 | 1627 Bjugn | -2 | |||||||||||||||||||||||||||||||||
| 8 | 1551 Eide | -52 | 1149 Karmøy | -115 | 2021 Kárájohka Karasjok | -1 | |||||||||||||||||||||||||||||||||
| 9 | 2017 Kvalsund | -48 | 0231 Skedsmo | -112 | 1736 Snåsa | -1 | |||||||||||||||||||||||||||||||||
| 10 | 1640 Røros | -48 | 1563 Sunndal | -112 | 1665 Tydal | -1 | |||||||||||||||||||||||||||||||||
| Excess of births (226 in total) |
Excess of births in relation to
population/1 000 (226 in total) |
Population growth (263 in total) |
Population growth in relation to
population/1 000 (263 in total) |
||||||||||||||||||||||||||||||||||||
| 1 | 0301 Oslo | 4 254 | 2027 Unjárga Nesseby | 9.3 | 0301 Oslo | 12 904 | 0615 Flå | 44.1 | |||||||||||||||||||||||||||||||
| 2 | 1201 Bergen | 1 099 | 1122 Gjesdal | 9.1 | 1201 Bergen | 3 239 | 0941 Bykle | 37.0 | |||||||||||||||||||||||||||||||
| 3 | 1601 Trondheim | 1 008 | 1529 Skodje | 9.1 | 1601 Trondheim | 2 518 | 0235 Ullensaker | 35.6 | |||||||||||||||||||||||||||||||
| 4 | 1103 Stavanger | 760 | 0229 Enebakk | 8.5 | 1103 Stavanger | 1 739 | 0226 Sørum | 34.9 | |||||||||||||||||||||||||||||||
| 5 | 1102 Sandnes | 504 | 1121 Time | 8.5 | 0219 Bærum | 1 281 | 0612 Hole | 33.4 | |||||||||||||||||||||||||||||||
| 6 | 1902 Tromsø | 497 | 1119 Hå | 8.4 | 0602 Drammen | 1 022 | 1529 Skodje | 32.8 | |||||||||||||||||||||||||||||||
| 7 | 0219 Bærum | 398 | 1120 Klepp | 8.3 | 1902 Tromsø | 997 | 1256 Meland | 31.3 | |||||||||||||||||||||||||||||||
| 8 | 1001 Kristiansand | 379 | 1124 Sola | 8.3 | 1102 Sandnes | 995 | 0214 ås | 31.1 | |||||||||||||||||||||||||||||||
| 9 | 1804 Bodø | 266 | 1102 Sandnes | 8.1 | 1001 Kristiansand | 994 | 1816 Vevelstad | 30.9 | |||||||||||||||||||||||||||||||
| 10 | 0231 Skedsmo | 208 | 1662 Klæbu | 8.1 | 0235 Ullensaker | 958 | 1018 Søgne | 28.6 | |||||||||||||||||||||||||||||||
| Birth deficit (190 in total) |
Birth deficit in relation to
population/1 000 (190 in total) |
Population decrease (163 in total) |
Population decrease in relation
to population/1 000 (163 in total) |
||||||||||||||||||||||||||||||||||||
| 1 | 0420 Eidskog | -40 | 1915 Bjarkøy | -19.6 | 1924 Målselv | -135 | 2017 Kvalsund | -44.5 | |||||||||||||||||||||||||||||||
| 2 | 0528 østre Toten | -32 | 1252 Modalen | -13.9 | 1824 Vefsn | -78 | 1252 Modalen | -36.1 | |||||||||||||||||||||||||||||||
| 3 | 0423 Grue | -31 | 0121 Rømskog | -12.3 | 1805 Narvik | -78 | 1917 Ibestad | -32.4 | |||||||||||||||||||||||||||||||
| 4 | 0403 Hamar | -29 | 1748 Fosnes | -11.6 | 2021 Kárájohka Karasjok | -74 | 1857 Værøy | -29.6 | |||||||||||||||||||||||||||||||
| 5 | 0520 Ringebu | -26 | 1571 Halsa | -10.8 | 1411 Gulen | -67 | 1411 Gulen | -28.4 | |||||||||||||||||||||||||||||||
| 6 | 0426 Våler | -25 | 1917 Ibestad | -10.6 | 1231 Ullensvang | -61 | 1825 Grane | -27.3 | |||||||||||||||||||||||||||||||
| 7 | 1566 Surnadal | -25 | 2014 Loppa | -9.9 | 1640 Røros | -58 | 2021 Kárájohka Karasjok | -25.8 | |||||||||||||||||||||||||||||||
| 8 | 0418 Nord-Odal | -24 | 1738 Lierne | -9.5 | 0536 Søndre Land | -55 | 1828 Nesna | -23.4 | |||||||||||||||||||||||||||||||
| 9 | 0425 åsnes | -24 | 1151 Utsira | -9.4 | 1627 Bjugn | -52 | 1723 Mosvik | -23.1 | |||||||||||||||||||||||||||||||
| 10 | 0534 Gran | -24 | 1265 Fedje | -8.4 | Tinn/Lødingen/Bø (N.) | -50 | 1927 Tranøy | -22.8 | |||||||||||||||||||||||||||||||
1 Corrected 21 November 2008.
The statistics is published with Population.
Additional information
Contact
-
Statistics Norway's Information Centre
E-mail: informasjon@ssb.no
tel.: (+47) 21 09 46 42